Q1 2026 Report | Beauty
Beauty Q1 2026: Why margin is up, but revenue and ROAS are down
See what's behind the shift:
Q1 Beauty data: tighter funnels, rising CPCs, and OOS gaps. Download the report.
Download the full report
Used by the most loved brands in the world
Key takeaways
Volume traded for profitability: Ordered revenue declined ~43% YoY on an indexed basis as the category reset toward higher-quality business
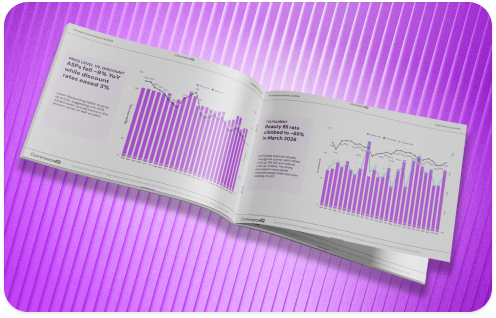
Pricing discipline lifted margins: ASP rose ~33% YoY while discount rates compressed from ~27–28% to ~17%, driving gross unit margins to ~54%, up 18+ ppts YoY

Top-of-funnel visibility eroded sharply: Glance views fell ~50% YoY and conversion rates softened to ~1.3–1.6%, down from ~1.5–1.9% a year prior
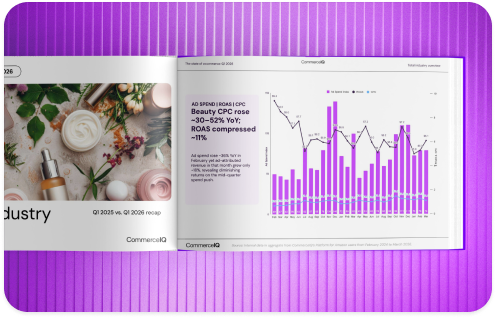
Ad efficiency held despite pullback: Ad spend dropped ~25% YoY while ROAS remained steady, with CPC easing to $0.56–$0.65 from $0.63–$0.73
PO fill rate surged to category-leading levels: PO fill rate climbed to ~68% on average, up ~25 ppts YoY, even as on-hand inventory dropped 25% YoY
Out-of-stock losses compressed to multi-year lows: OOS revenue loss fell ~53% YoY, and Rep OOS rates hit 26-month lows of ~0.9–1.4%, down from 2.6–4.6% a year earlier
Download the full report
More reports
Explore retail reports packed with trends, data, and strategies


Supercharge your ecommerce growth with AI
Unlock automation, optimize performance, and maximize profitability with CommerceIQ.